The only training simulator where the chart hasn't happened yet.
Historical charts are readable — your brain already knows the ending. So we generate brand-new synthetic charts that move with realistic, true-to-life price behavior. Every chart is synthetic, every chart is unseen, and every decision you practise is your own.
Not backtesting. Not paper trading. Something built for how real trading actually feels.
Three ways to practice options. Only one of them trains you to decide under genuine uncertainty.
| Backtesting | Paper Trading | Options Simulator | |
|---|---|---|---|
| Data source | Historical — you know how it ends | Live market — slow and news-driven | Synthetically generated — no one has seen it |
| Hindsight bias | High | Low | None |
| Speed | Fast (reads the past) | Real-time (days to weeks) | Controllable (1× to 10×) |
| Decision pressure | None — outcome is already known | Some — but delayed | High — every candle is unknown |
| Options coverage | Limited | Depends on broker | Full chain, 35+ strategies, all Greeks |
| Cost to start | Paid platforms / scripting | Broker account required | Free, no signup |
Your backtests looked great. Real markets felt different. Here's why training matters.
Practise on markets nobody has ever seen.
Backtesting replays history — your brain reads the chart backwards, even when you think it doesn't. Our 8 models generate completely new price data with realistic, true-to-life behavior. Steady drifts, sudden shocks, shifting volatility, perfect storms — you never know what comes next.
Charts that move like the real thing.
From Steady Drift for beginners to Perfect Storm for professionals — each model simulates different market behaviour with increasing accuracy. Essential models teach you the fundamentals. Advanced Dynamics add realistic volatility behaviour. Professional Grade models deliver the most detailed, lifelike price behavior the simulator generates.
A year of synthetic chart in 5 minutes.
Paper trading means waiting weeks for results on data you already suspect. Here, you generate an entire year of synthetic chart and practise 35+ options strategies — from Covered Calls to Iron Condors — in a single session. Your AI Mentor explains every decision, walks you through the Greeks, and highlights textbook strategies that historically match this simulated scenario.
Start practising in three steps
Choose a model and a ticker
Pick one of 8 price models and enter a ticker symbol. Each model generates a brand-new, unknown synthetic scenario — no two simulations are ever the same.
Generate and play
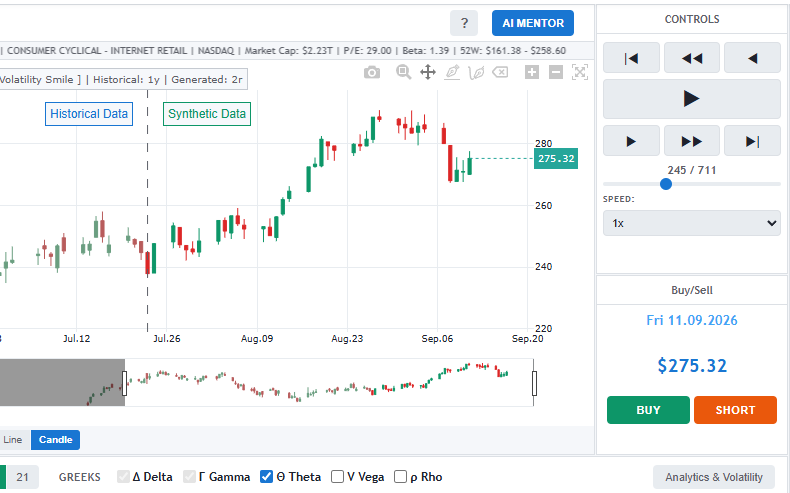
Generate the chart and watch price unfold candle by candle, in real time or at up to 10× speed. Pause, rewind, or step through single candles whenever you want to think.
Trade and analyze
Buy and sell stocks and options, track your portfolio and Greeks live, and learn from the outcome of every simulated trade — with an AI Mentor explaining the why behind each move.
The full mechanics of a trading platform. None of the real risk.
Generate a synthetic market. Then simulate trades on it — with a full option chain, real-time Greeks, portfolio tracking, and professional analytics.
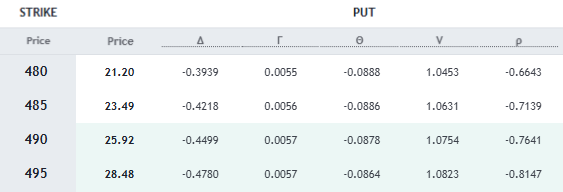
Option Chain & Greeks
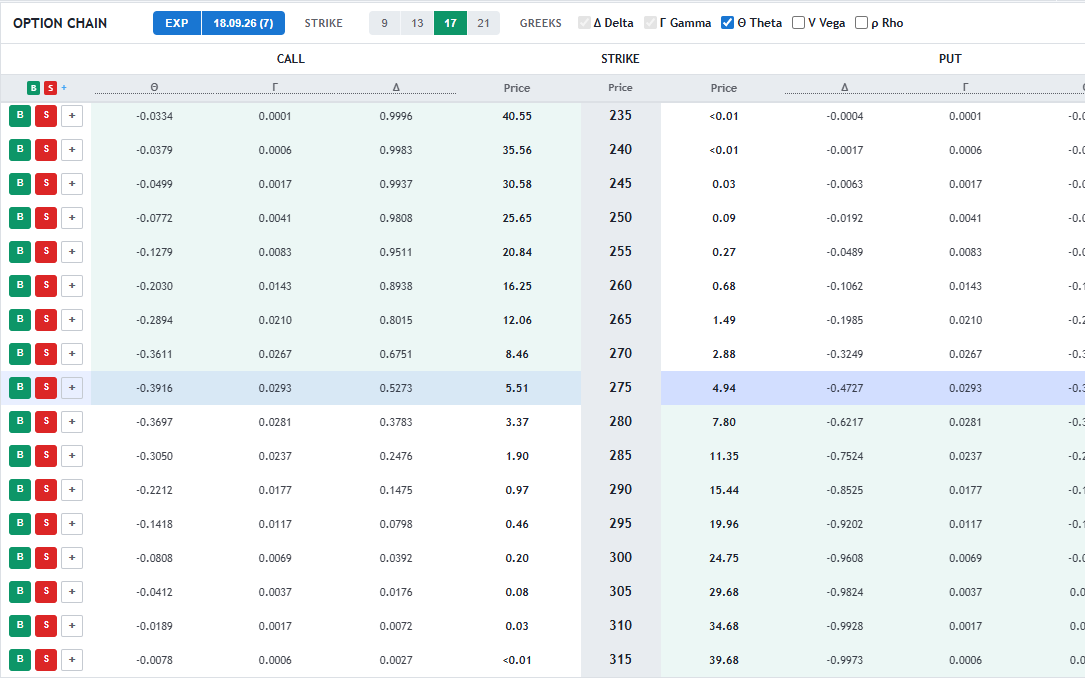
Full option chain with calls, puts, realistic strike prices, and real-time Greeks — Delta, Gamma, Theta, Vega, Rho. Buy and sell synthetic options just like you would on a real broker platform — except nothing is settled in real markets.
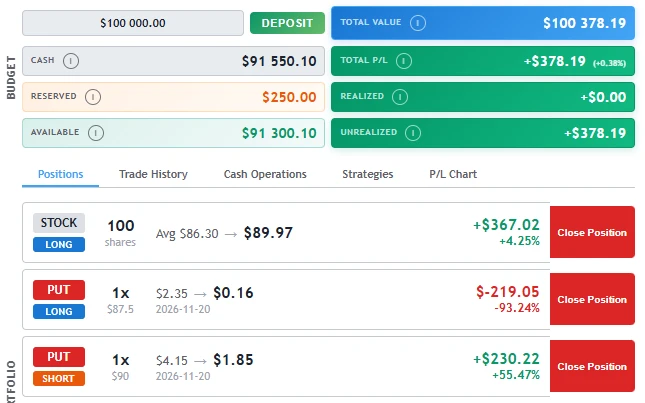
Portfolio & Positions
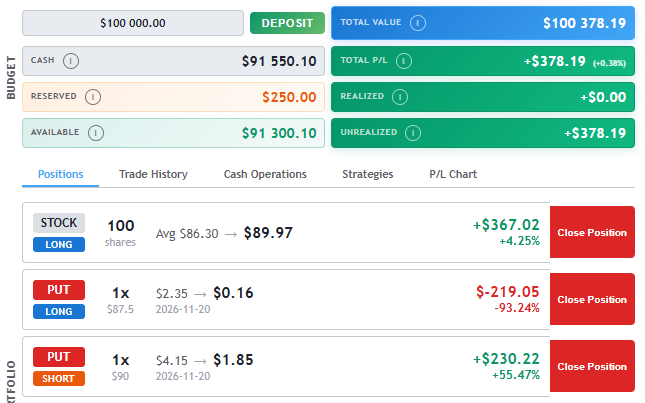
Track your cash, open positions, unrealized P/L, and portfolio Greeks in real time. Close positions, manage risk, and watch your simulated strategy play out.
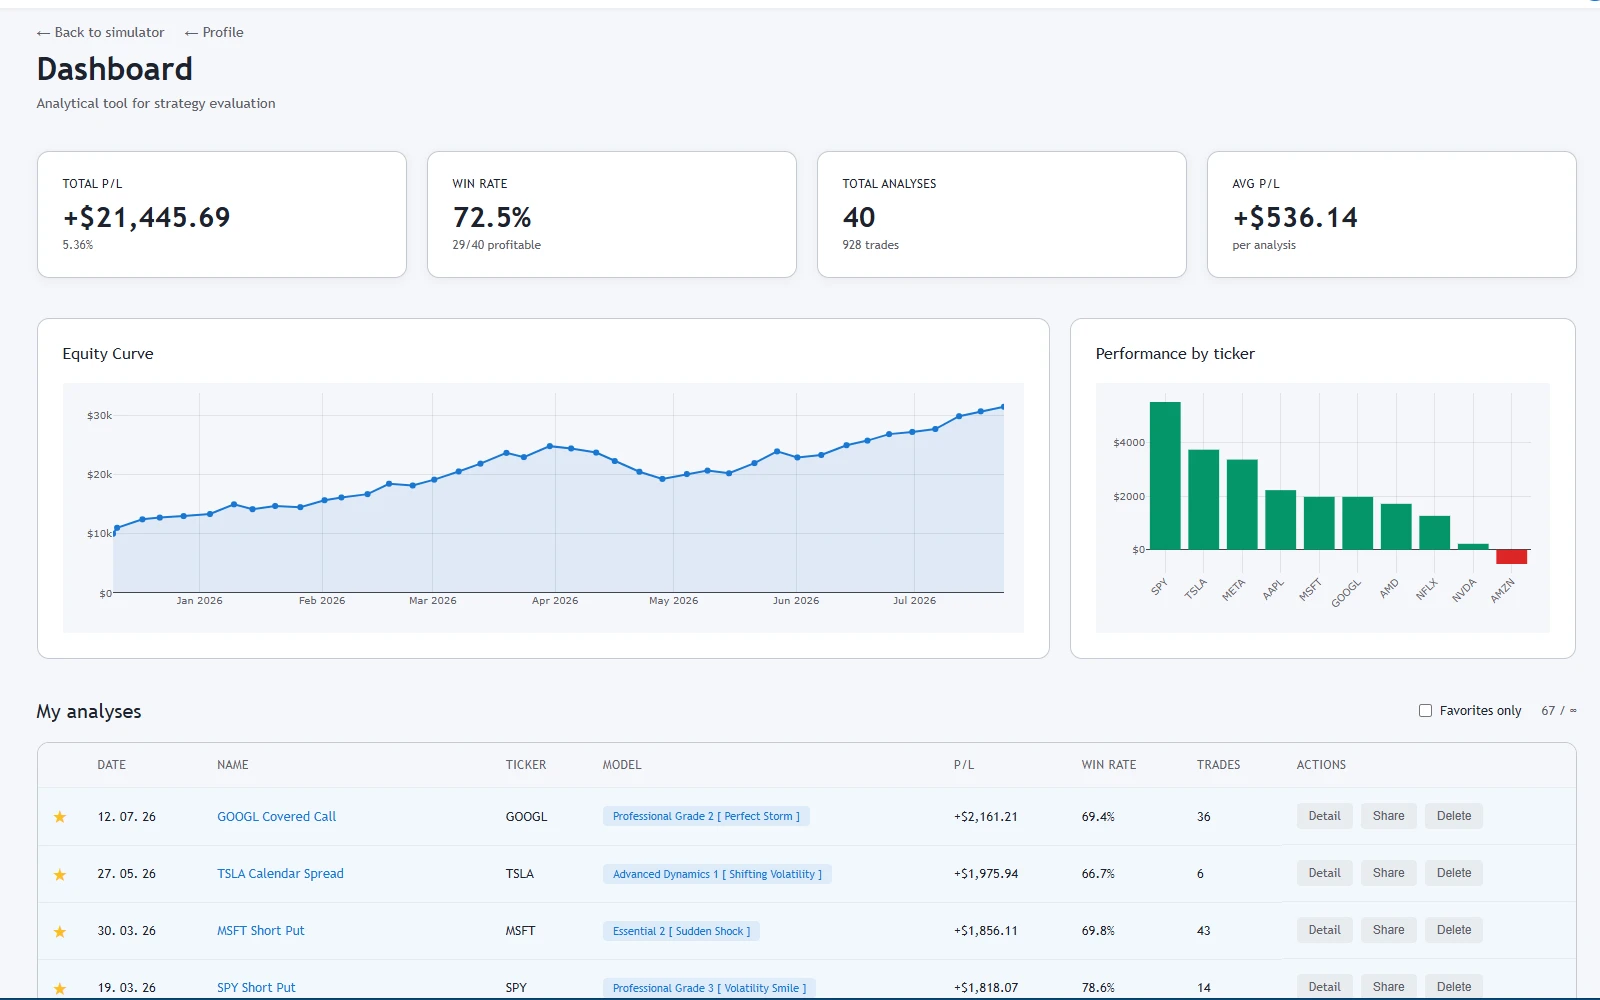
Dashboard
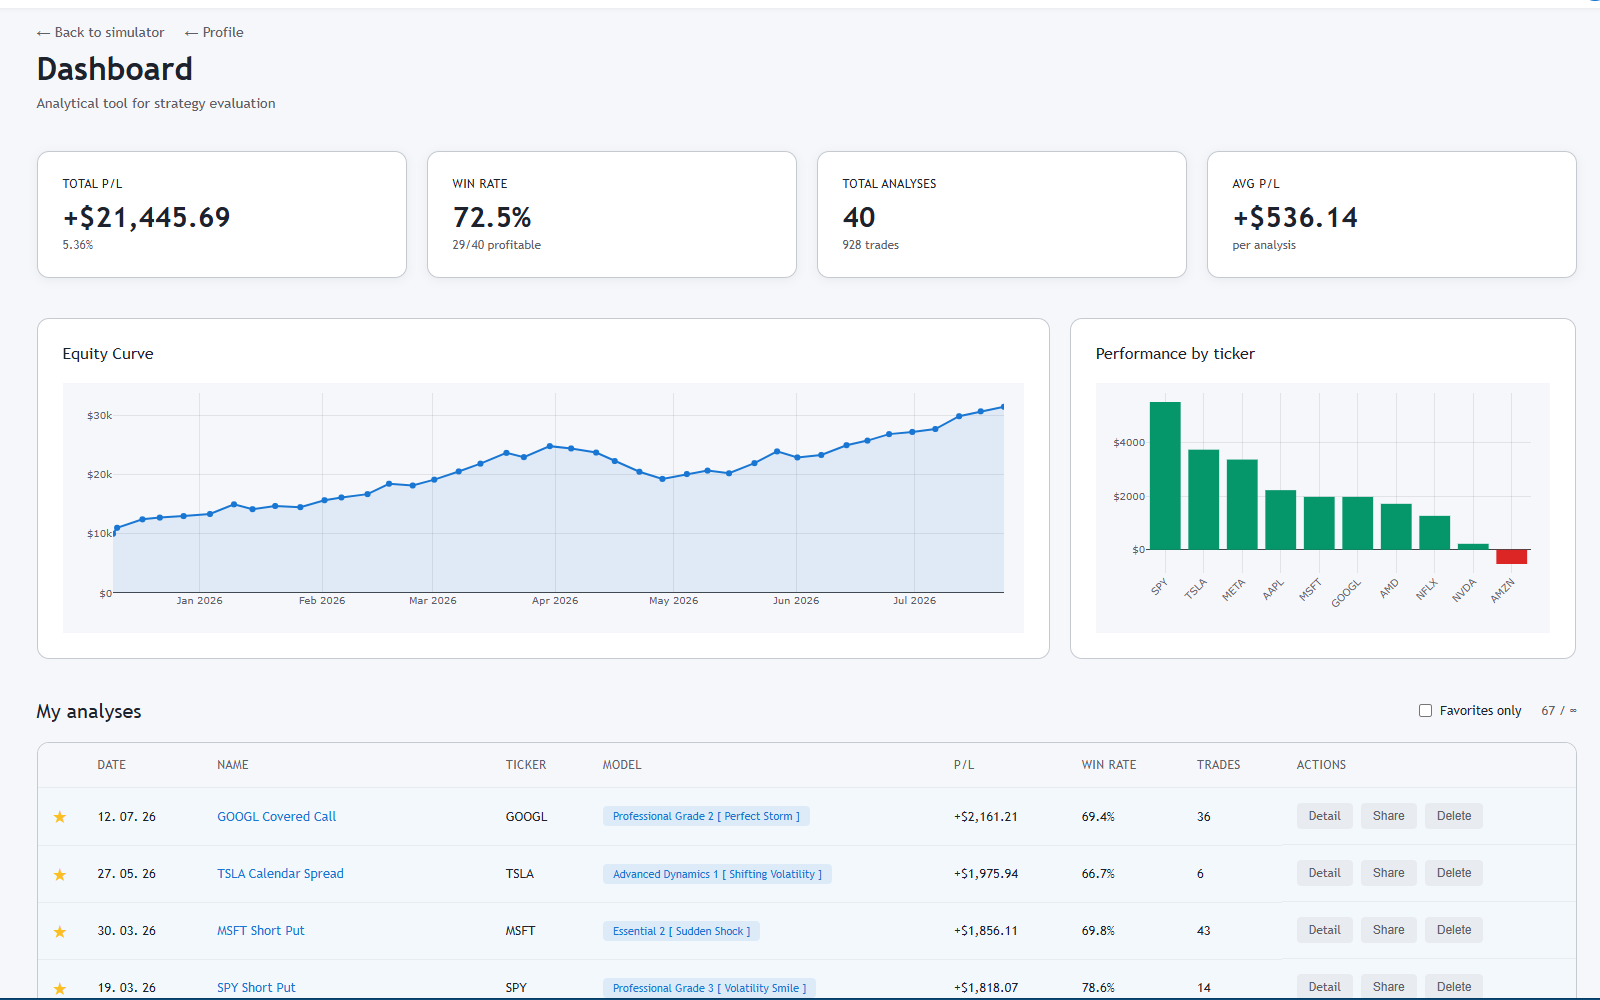
Save your simulations and analyze your performance over time. Equity curve, win rate, P/L by ticker, and a full history of every analysis you've run.
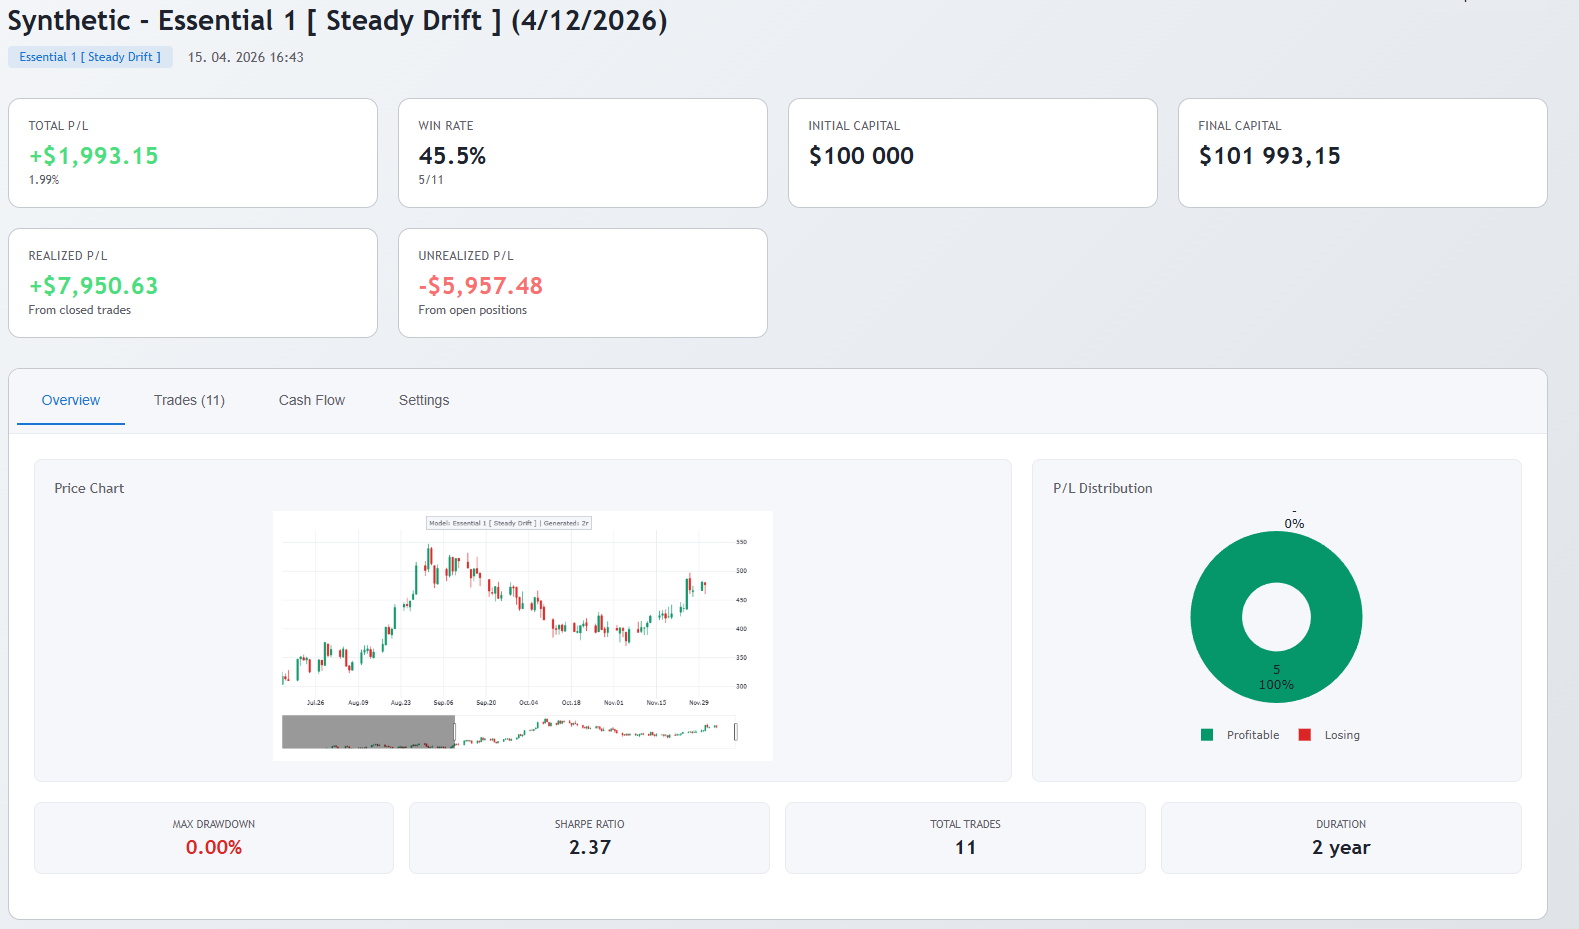
Deep Analytics
Sharpe ratio, max drawdown, P/L distribution, total trades — professional-grade metrics that tell you not just the simulated outcome, but how and why your decisions played out.
Don't just click. Understand the mechanics.
Professional-grade analytics that explain what this synthetic chart is doing right now, what textbook patterns it resembles, and which educational strategies typically match this scenario.
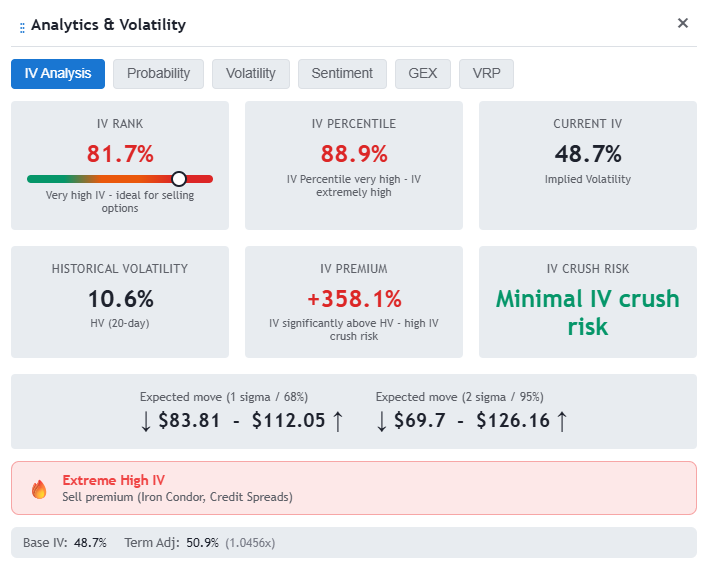
IV Analysis
Know when volatility is extreme. IV Rank, IV Percentile, expected price range, and IV crush risk — all in one view. The simulator shows whether the options in this synthetic scenario are statistically cheap or expensive based on IV Rank and Percentile.
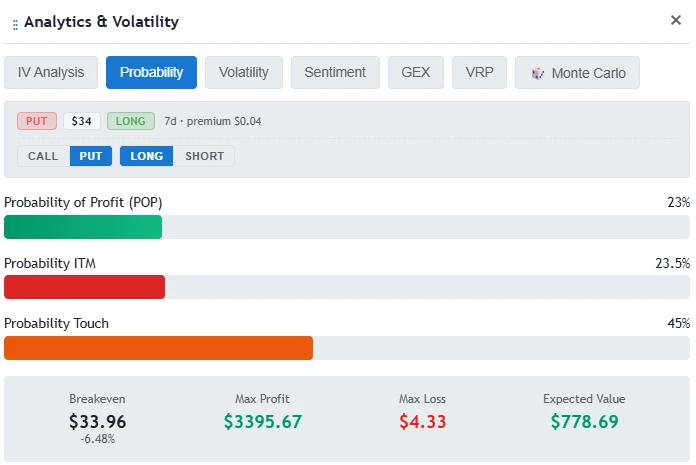
Probability
See the textbook probability of profit before you place a simulated trade. Probability of Profit, breakeven price, max profit, and max loss — calculated in real time for your exact position.
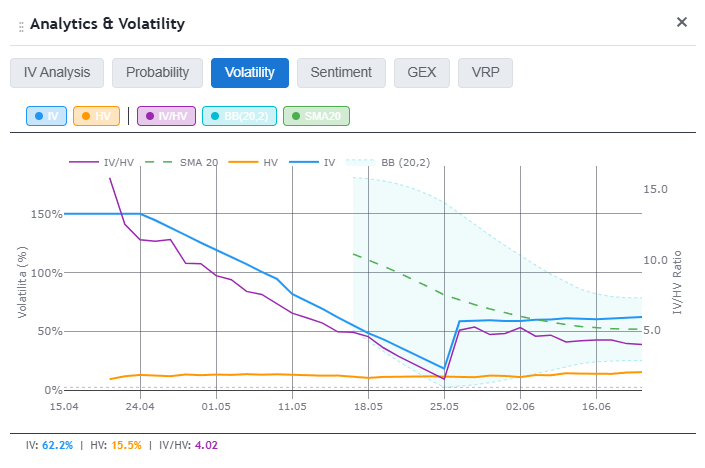
Volatility
Track implied vs. historical volatility. Visual comparison of IV and HV over time with Bollinger Bands and moving averages. Spot when synthetic volatility is statistically mispriced in this scenario.
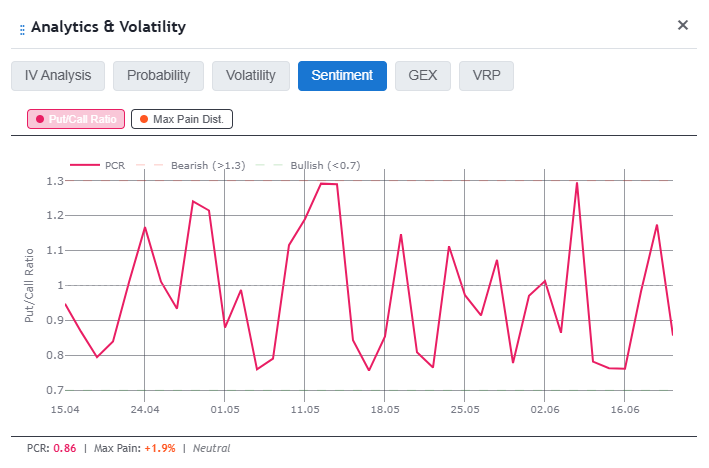
Sentiment
Read the synthetic market's mood. Put/Call Ratio and Max Pain analysis show where the crowd is positioned — and where this simulated chart might move next.
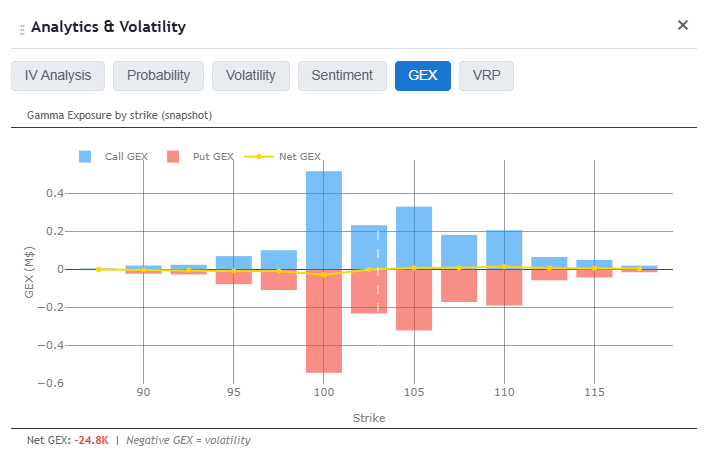
GEX
Learn how Gamma Exposure analysis is read by market makers. Gamma Exposure by strike reveals where market makers are positioned, helping you anticipate potential support and resistance levels.
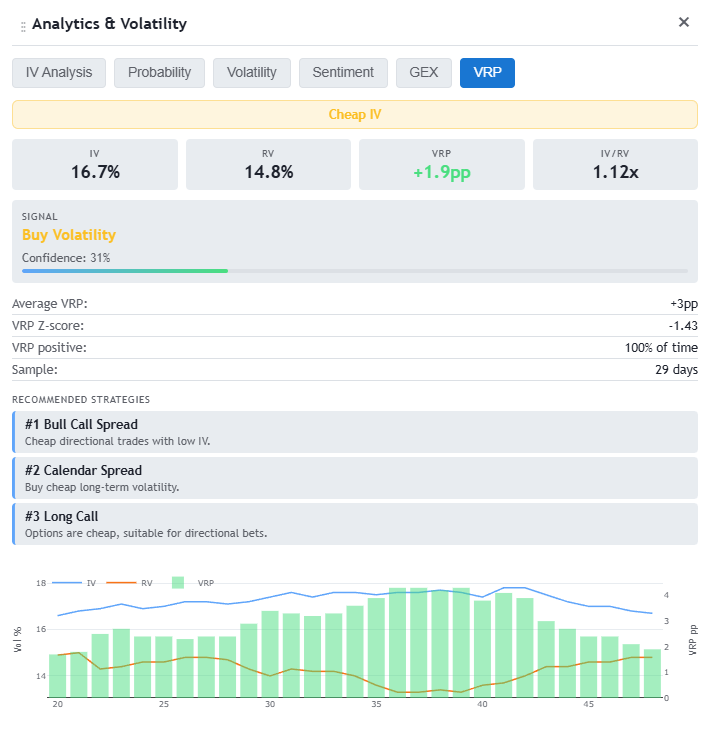
VRP & Textbook Plays
Practise reading VRP regimes and see which textbook plays historically match them. In this scenario, the simulator highlights educational examples — not personalised investment advice.
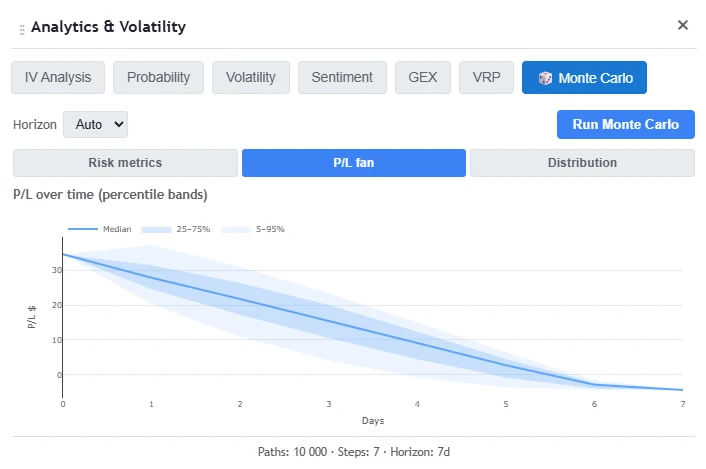
Monte-Carlo
See the full range of outcomes, not a single guess. Monte Carlo runs thousands of simulated price paths to build a P/L distribution, fan chart, VaR/CVaR, and probability of profit for your position. It shows how this synthetic scenario could unfold across many possible futures — so you can weigh risk before you commit.
8 ways a synthetic chart can unfold.
From steady growth to sudden crashes. Each model creates a different synthetic scenario — all realistic, all completely unknown.
Essential
The foundation. Learn the basics of market simulation.
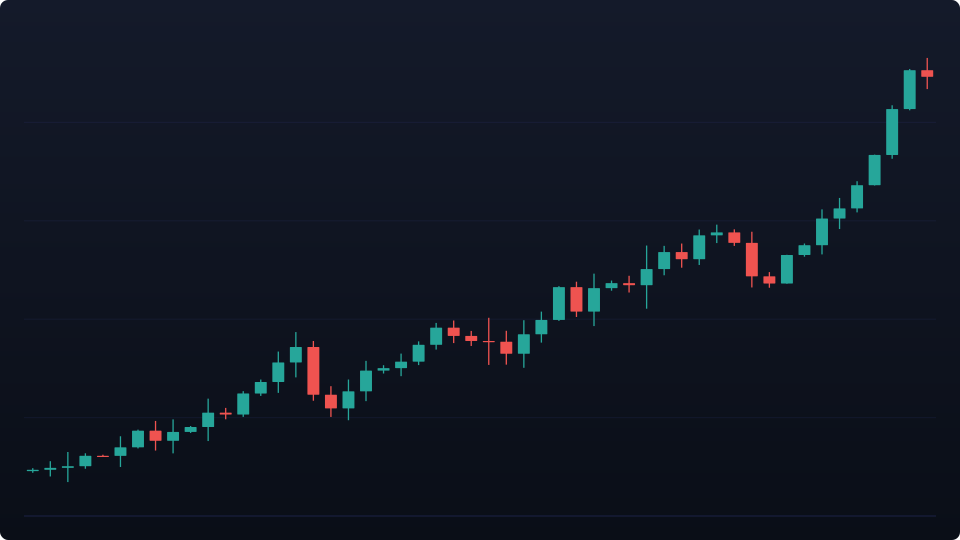
Smooth market movement with a gradual trend
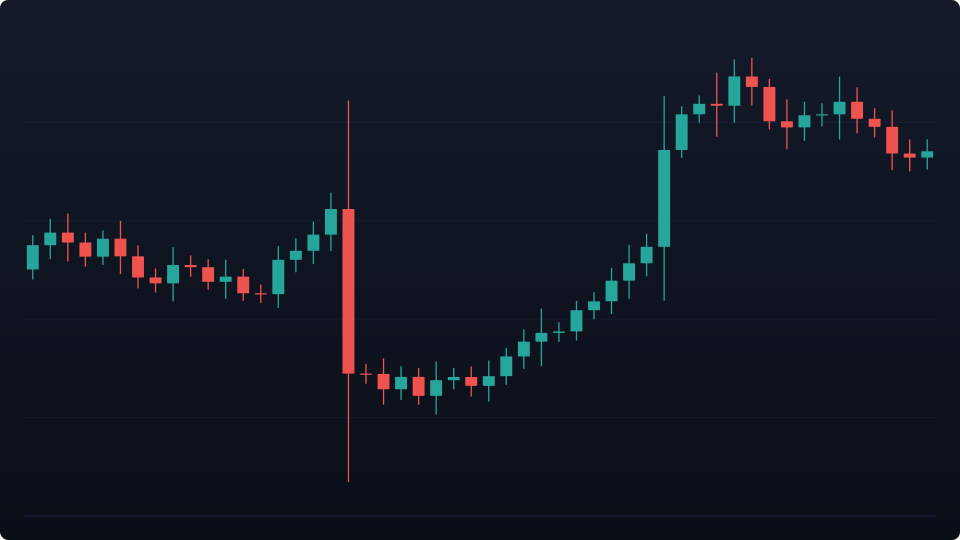
Unexpected price jumps from news or events
Advanced Dynamics
More realistic behaviour. Volatility that shifts and trends that persist.
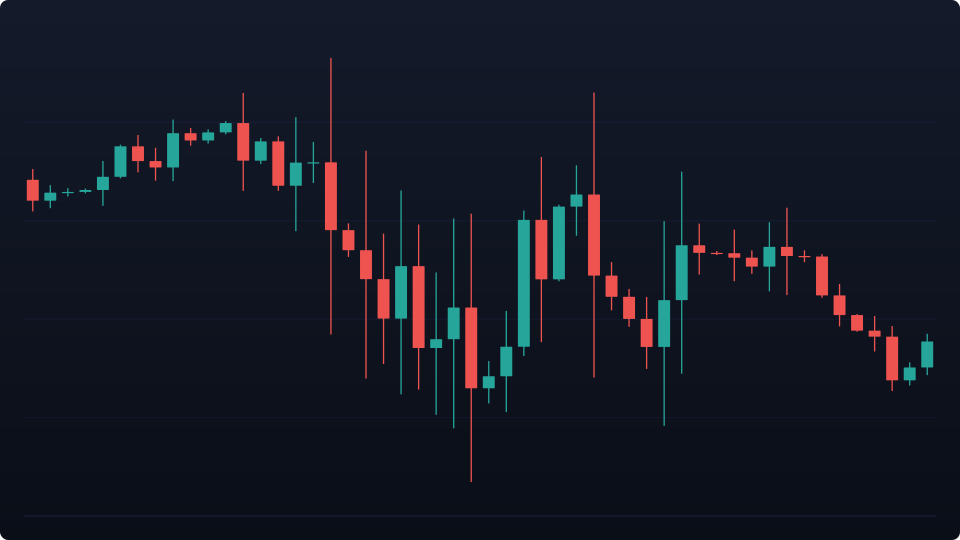
Volatility changes over time — calm, then wild
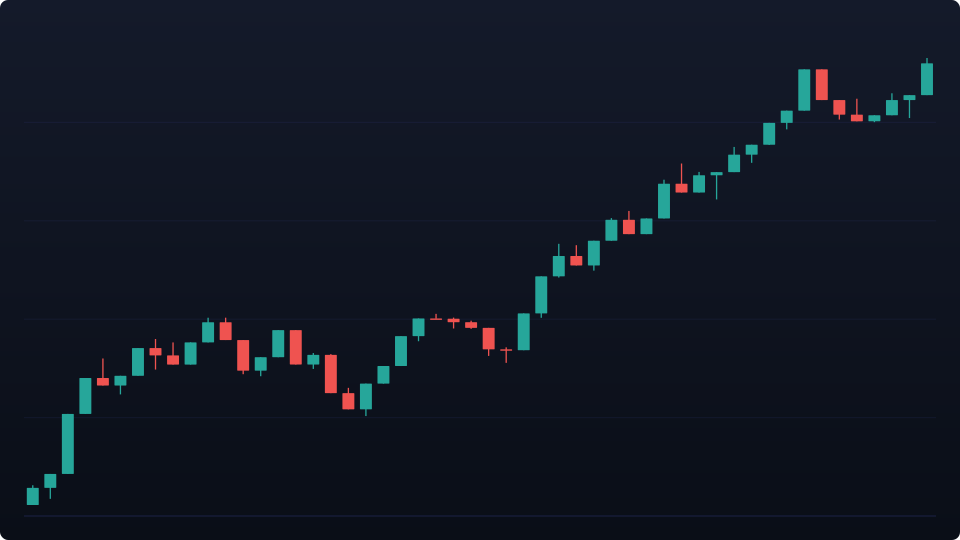
Long-term trending or mean-reverting behaviour
Professional Grade
The simulator's most detailed, lifelike price behavior.
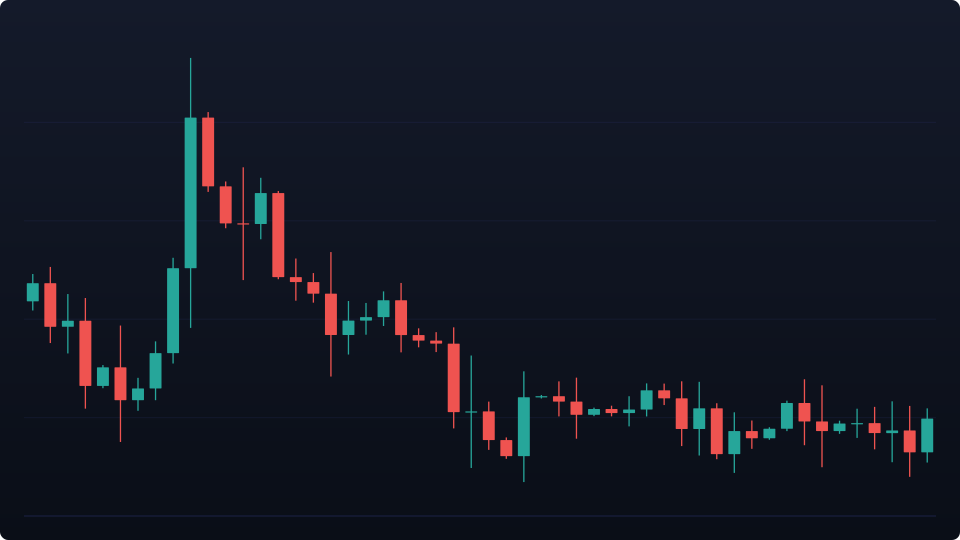
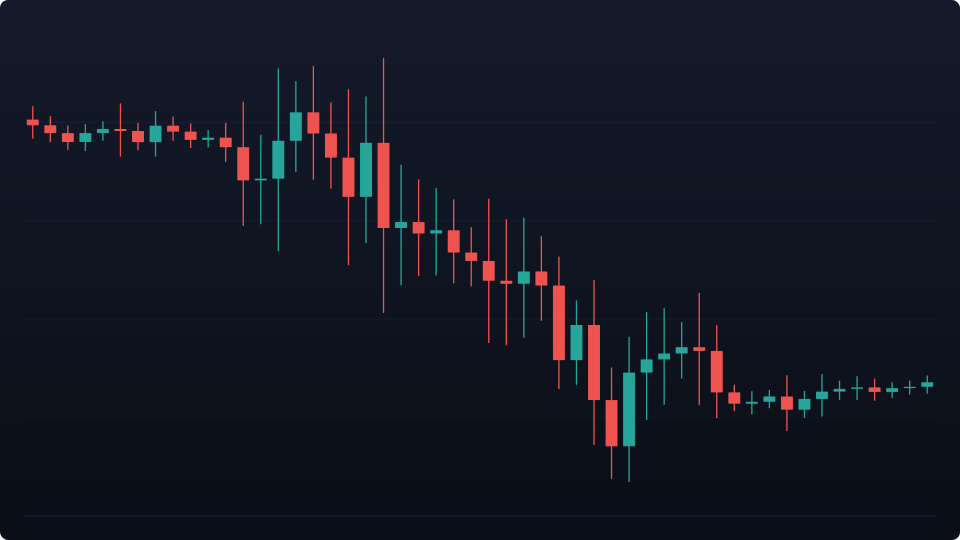
Quiet periods erupt into chaos — volatility clustering
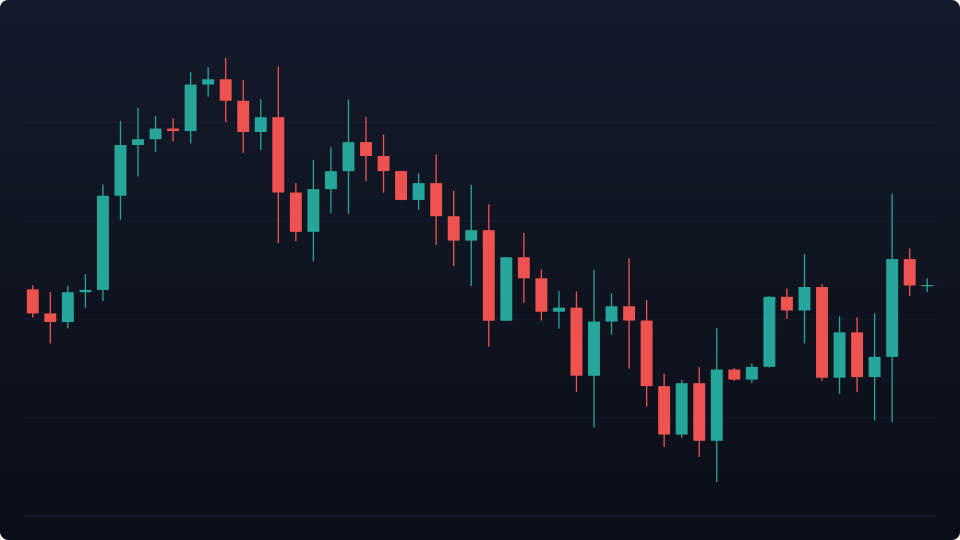
Stochastic volatility combined with sudden jumps
Professional volatility-surface modelling
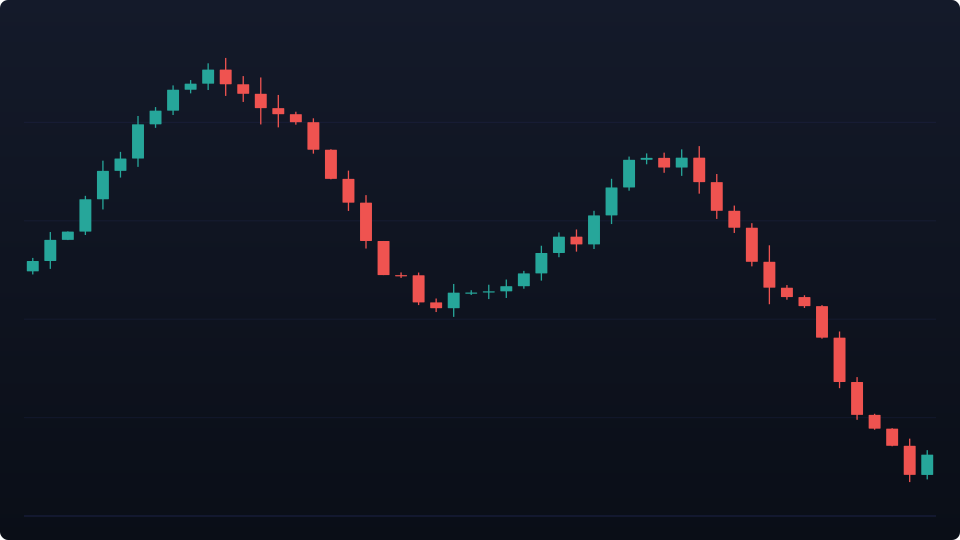
Machine-learned market behaviour extracted from historical patterns
The questions every trader asks before they try it.
Straight answers to the objections we hear most often.
Simulated data isn't real — so what's the point?
Why pay for this when I can backtest for free on tastytrade?
You don't have real live data or an order book.
I can just paper trade on my broker for free.
8 models sounds complicated for a beginner.
Start practising today
Pick your level. Upgrade when you're ready.
- Chart Generation
- Play / Pause / Step
- Forward ( ⏭ )
- Trading (stocks + options)
- Reset Portfolio
- Option Chain & Greeks
- Basic Strategies (Conservative | Moderate)
- AI Mentor (main chat)
- Analysis & Report
- Everything in Free
- Rewind ( ⏮ )
- Cash Deposit
- Reset Simulation
- Portfolio Greeks Summary
- Advanced Strategies (Agressive | Speculative )
- AI Mentor (trade + strategy)
- Save to Dashboard
- Save Session
- Monte Carlo Option Pricing
- Monte Carlo Risk Analytics
- Everything in Basic
- Historical Data (only S&P500) non backtesting
- Speed & Slider
- Custom Strategy Builder
- Analytics & Volatility
- Export XLSX (dashboard)
- Auto-save Session
- Monte Carlo Strategy Stress Test
- Everything in Premium
- No recurring billing
- 14-day money-back guarantee
Lifetime access: $499 (one-time payment)
Yearly plans save 20%